What are the top 5 Forex charts every trader should know?
When it comes to Forex trading, charts are an essential tool for analyzing price movements, identifying trends, and making informed trading decisions. Traders rely on various types of charts to gain insights into the market and develop effective trading strategies. In this blog post, we will discuss the top 5 Forex charts that every trader should know. Let’s dive in!
1. Line Charts
Line charts are the most basic type of Forex chart and are widely used by traders. They display the closing prices of a currency pair over a specific time period by connecting the closing prices with a line. Line charts provide a clear visualization of the general direction of a trend and are useful for identifying support and resistance levels.
2. Bar Charts
Bar charts, also known as OHLC (Open, High, Low, Close) charts, provide more detailed information compared to line charts. Each bar on the chart represents a specific time period and displays the opening and closing prices as well as the highest and lowest prices reached during that period. Traders can easily identify price ranges, trends, and key levels using bar charts.
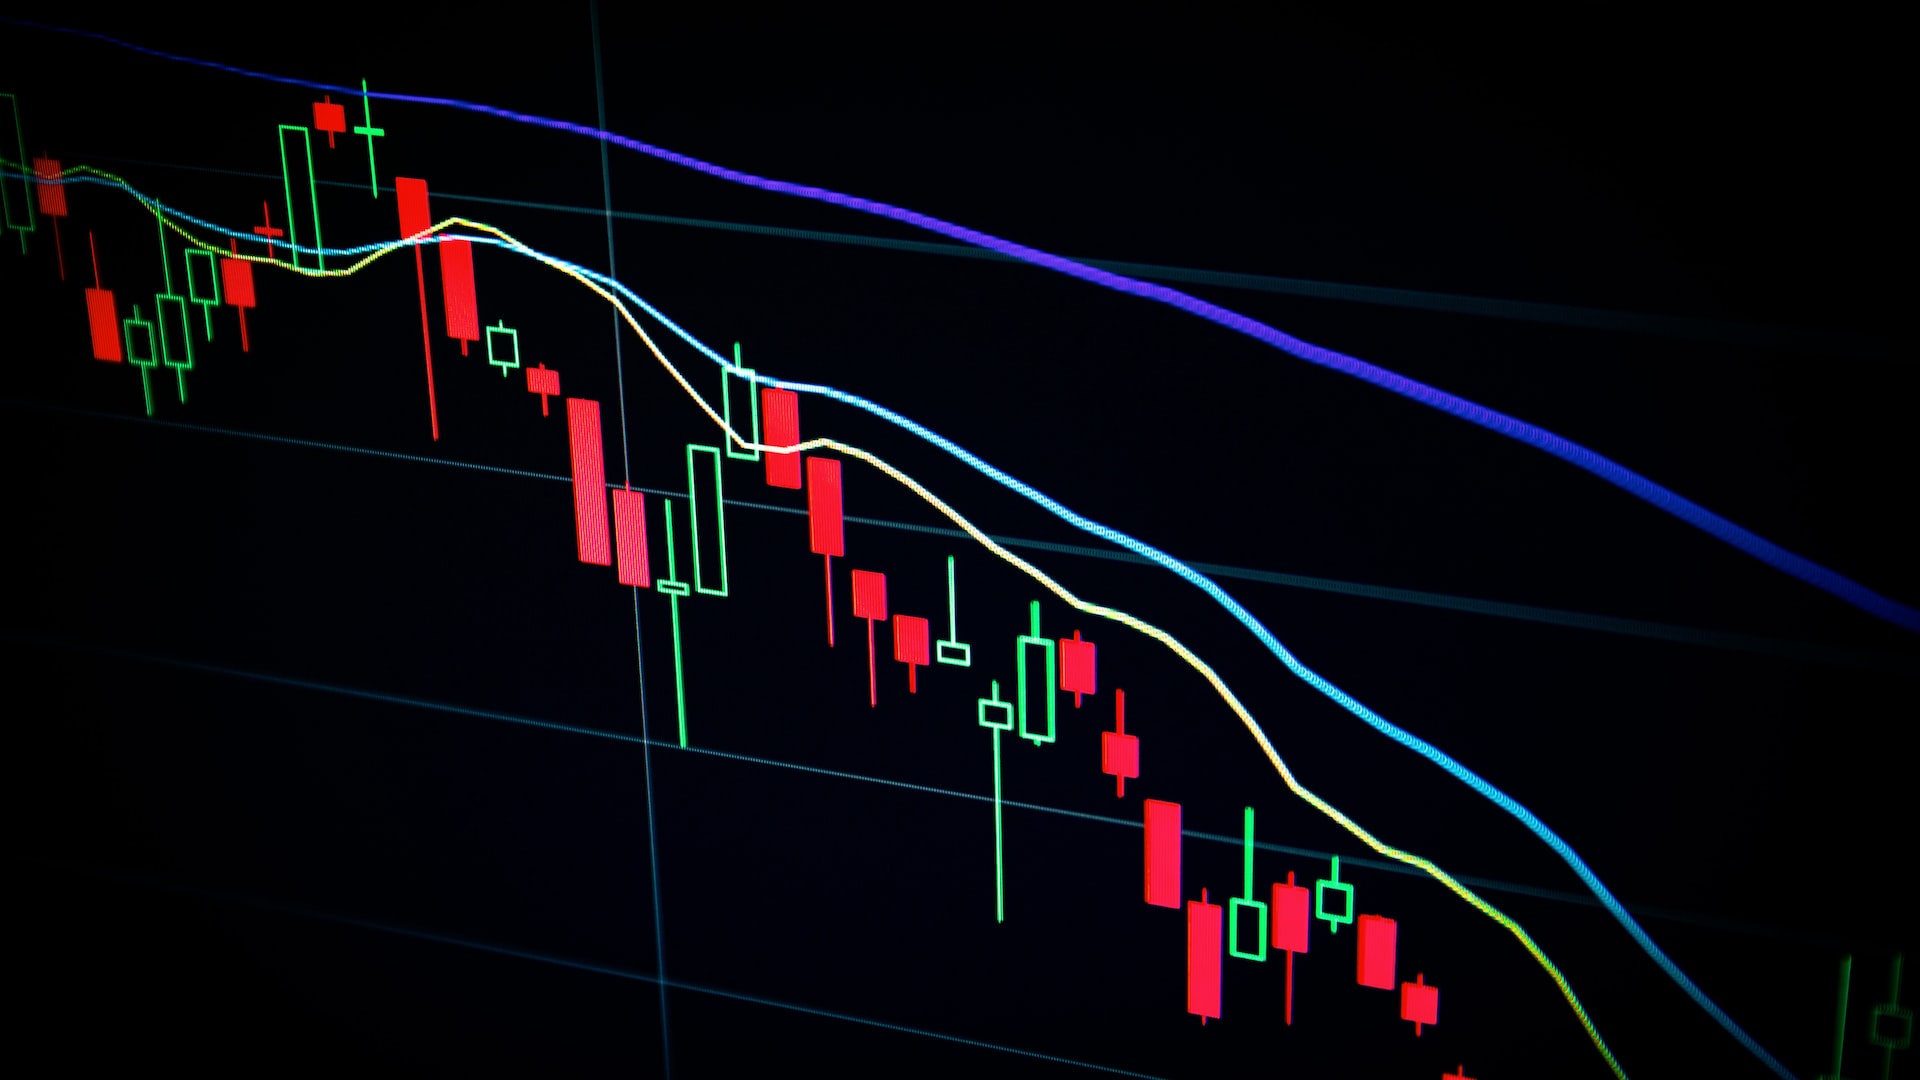
3. Candlestick Charts
Candlestick charts are widely used by Forex traders due to their ability to convey a wealth of information in a visually appealing manner. Each candlestick represents a specific time period and displays the opening, closing, high, and low prices. The body of the candlestick is filled or hollow, indicating whether the closing price was higher or lower than the opening price. Candlestick patterns help traders identify potential trend reversals and continuation patterns.
4. Renko Charts
Renko charts are unique because they focus solely on price movements and ignore time. These charts use bricks or blocks to represent price changes. A new brick is formed only when the price moves by a specific predefined amount. Renko charts filter out minor price fluctuations, making it easier for traders to identify significant trends and reversals.
5. Point and Figure Charts
Point and Figure charts are another type of chart that eliminates the element of time. Instead, they focus solely on price movements, specifically changes in supply and demand. These charts use X’s and O’s to represent price movements. X’s indicate rising prices, while O’s indicate falling prices. Point and Figure charts are particularly useful for identifying support and resistance levels and spotting potential breakouts.
Conclusion
Understanding and utilizing different types of Forex charts is essential for successful trading. Line charts, bar charts, candlestick charts, Renko charts, and Point and Figure charts all offer unique perspectives on price movements and can help traders make informed decisions. By familiarizing themselves with these top 5 Forex charts, traders can gain valuable insights into market trends, identify trading opportunities, and improve their overall trading performance.