

Introduction
Technical analysis is a popular approach used by forex traders to make informed trading decisions based on historical price data. By studying charts, patterns, and indicators, traders aim to predict future price movements. In this blog post, we will explore how technical analysis works in forex trading.
1. Analyzing Price Charts
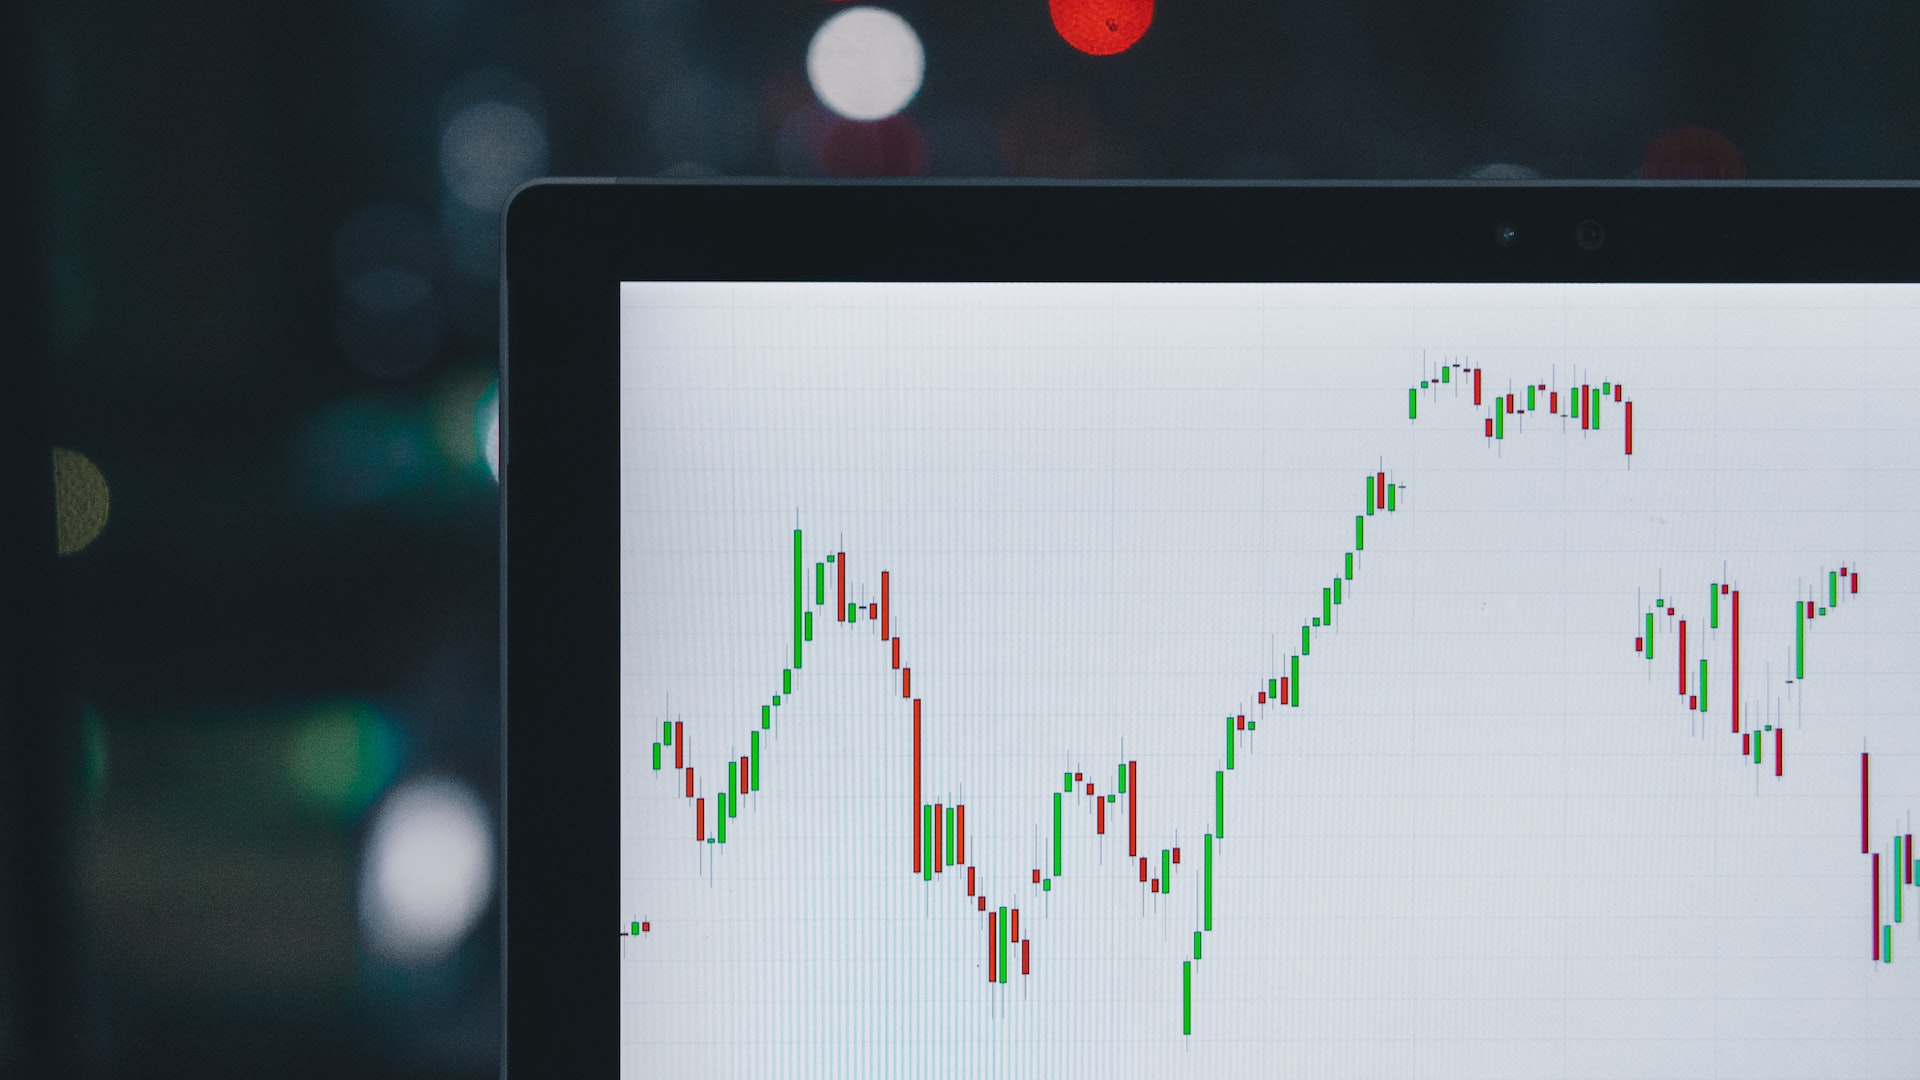
Candlestick Charts
Technical analysis primarily involves the analysis of candlestick charts, which display price data over a specific period. Each candlestick represents a specific timeframe, such as one hour or one day, and provides information on the opening, closing, high, and low prices during that period. Traders use these charts to identify patterns and trends.
Identifying Patterns
One of the key aspects of technical analysis is identifying patterns in price charts. Traders look for recurring patterns, such as head and shoulders, double tops or bottoms, triangles, and more. These patterns can indicate potential reversals or continuation of trends. By recognizing these patterns, traders can make more informed trading decisions.
2. Applying Technical Indicators
Moving Averages
Technical indicators are mathematical calculations applied to price data to generate insights into potential future price movements. One commonly used indicator is the moving average, which calculates the average price over a specific period. Traders use moving averages to identify trends and potential support and resistance levels.
Oscillators
Oscillators are another type of technical indicator that helps traders identify overbought or oversold conditions in the market. Popular oscillators include the Relative Strength Index (RSI) and the Stochastic Oscillator. By analyzing these indicators, traders can determine when a currency pair may be due for a reversal or correction.
3. Support and Resistance Levels
Support Levels
Support levels are price levels where buying pressure is expected to emerge, preventing further downward movement. Traders identify these levels by observing previous price lows or areas where the price has historically found support. Support levels can act as potential entry points for bullish trades or as areas to place stop-loss orders.
Resistance Levels
Resistance levels are price levels where selling pressure is anticipated, halting further upward movement. Traders identify these levels by observing previous price highs or areas where the price has historically encountered resistance. Resistance levels can act as potential entry points for bearish trades or as areas to place profit targets.
Conclusion
Technical analysis in forex trading involves analyzing price charts, identifying patterns, and applying technical indicators to predict future price movements. By studying candlestick charts, recognizing patterns, and utilizing indicators such as moving averages and oscillators, traders can gain insights into potential market trends and reversals. Additionally, support and resistance levels provide valuable information for determining entry and exit points. While technical analysis is a powerful tool, it should be used in conjunction with other forms of analysis and risk management techniques. With practice and experience, traders can enhance their trading strategies and make more informed decisions in the dynamic forex market.